See the tide,
not the price.
Candles are what liquidity already did. God Mode computes the live institutional tide off the index and futures tape — so you watch where size actually rests and moves, in real time, underneath the price. The audited bot that trades those reads comes with it — proof, not the pitch.
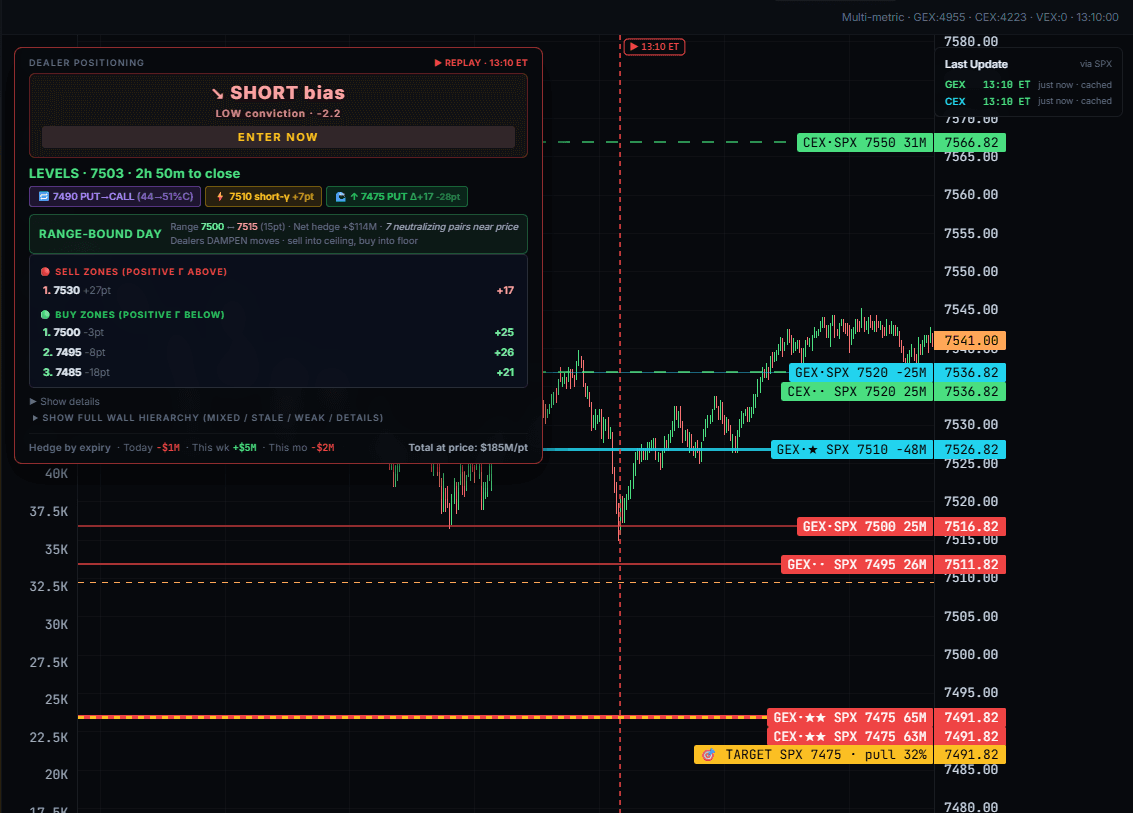
Candles show you the shadow. God Mode shows you the object.
Everyone reads the candle.
We read what casts it.
Candles are what liquidity already did. God Mode computes the live institutional tide off the index and futures tape — so you watch where size actually rests and moves, in real time, underneath the price.
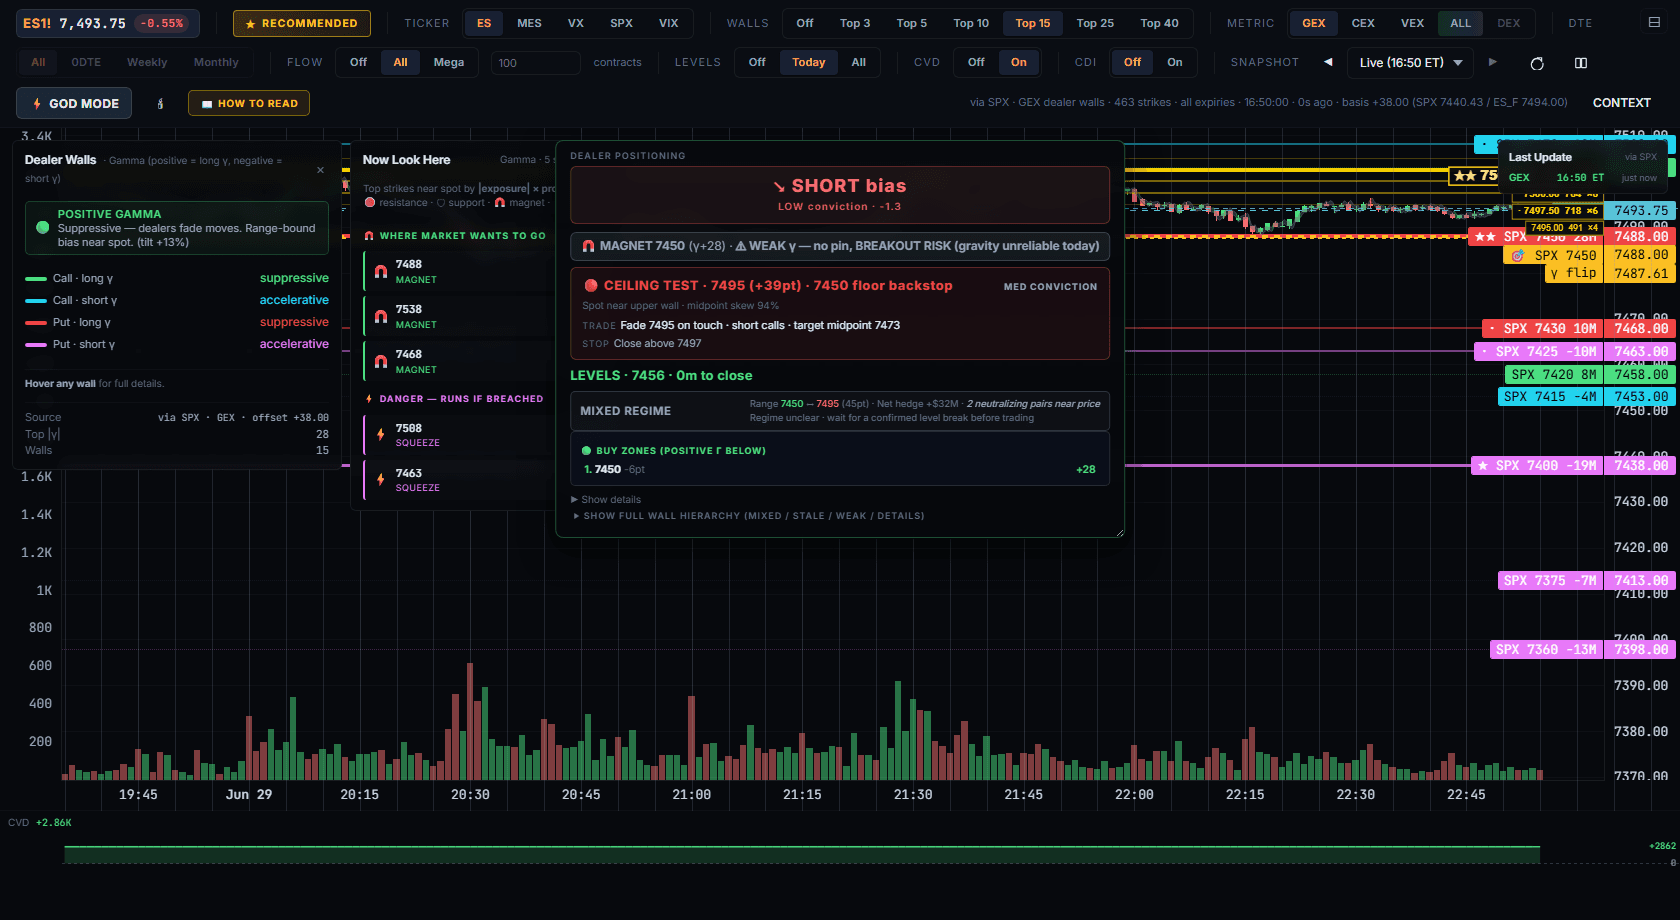
The tide, not the candle
One click swaps the chart for a live liquidity-tide ribbon, computed straight off the index futures order flow. You stop watching price react and start watching the size that moves it.
Computed live off the index
Not a redraw of price, not a noisy options heatmap. God Mode reads the S&P 500 and VIX futures tape — ES and VX — in real time and resolves it into the live structure of where institutional size rests, builds, and pulls.
Structure before the print
Flow leads price. The tide shifts before the bar closes — so you read the level forming, not the level that already broke. You stop reacting to the candle and start reading what's underneath it.
This is the real terminal — populated with sample data so you can click around without seeing today's live market.
Everyone ships the same map. Dealer positioning, gamma, walls — table stakes. We ship it too.
That's the standard toolkit — the dealer-positioning map: gamma, charm, vanna, walls. It's genuinely useful, and we ship it too. But a map only tells you where dealers might hedge. The piece nobody draws is the live liquidity moving through those levels — who's actually committing size right now, and where it's being absorbed. That's the missing puzzle piece. That's the tide.
The map is table stakes now. The edge is the liquidity underneath.
The read is the product. The bot is the proof. Its live feed is landing next.
The algorithm computes the live liquidity tide off the index futures and flags where size is forcing a move. That read is the product, and it's fully live right now — the same one you watch in the terminal every session.
Not yours. Not ours. A single real human's Interactive Brokers account, with real capital — the +$524K account above. That's the bot's audited track record: proof the read converts into closed, day-traded SPX options trades.
We're integrating the bot's live feed into the site now — going live over the next 1–3 months, included in your subscription at no extra cost. When it lands, every fill (strike, expiry, stop, target) publishes to your feed the instant the broker confirms, for you to mirror at your own size. Never auto-execution — your broker, your finger, your trigger.
Every closing bell, the algorithm re-tests the day.
At 16:00 ET each session, a regression engine replays every level the bot called against tick-level fills from the day's tape. The pass marks which levels held, which broke, and what the next-day positioning shifted toward. Subscribers see the rolling 30-day output in their dashboard.
The moment the cash session closes, the server replays the day's tape and re-prices every called level.
The last six trading weeks of regression output, every level, every outcome, available in the dashboard.
Strict day-trading. The bot opens and closes inside the same cash session. No overnight risk, no swing book.
We publish what we called. Misses included.
Hit = price reached the called level intraday · Range = price stayed inside the zone · Miss = price broke out the wrong side.
The terminal is live today. The bot is landing next.
The platform is fully operational right now. We're finishing the last piece — wiring the trading bot's live signal feed into your dashboard — and rolling it out over the next 1–3 months, included at no extra cost.
- The God Mode terminal — live, every session
- Live liquidity-tide reads + dealer flow on the index futures
- Full charting: gamma walls, CDI, CVD, key levels
- Daily market commentary
- The bot's audited track record — the +$524K account
- The automated signal feed — the bot's live entries & exits published straight to your dashboard the instant they fill
- Every trade with strike, expiry, stop and target — mirror it at your own size, in your own broker
- Included in your subscription — no price change when it lands
Subscribe today for the live terminal and God Mode; the automated feed switches on for you automatically as it rolls out.
This was a private beta. It's now closed.
Truthfully, this was mostly a programming exercise — a sandbox to build and stress-test the backend: the data pipelines, the live terminal, and the plumbing behind GOD MODE. The public-facing side was really just here to put the whole stack through its paces. That phase is done, so there's nothing to buy here.
And if you somehow found your way onto this page? Well… lucky you. 🙂
Already a member? Sign in →
We'd rather lose the sale than waste your time.
- 01
You trade meme stocks.
We don't cover them. We cover SPX, and that's the entire ticker universe. If your edge is GME or PLTR, this isn't useful.
- 02
You want 47 indicators.
We removed them on purpose. The product is two numbers and a conviction score. If you need a dashboard with 12 panels, you'll be bored.
- 03
You want backtests.
We don't publish them. The tape page is real trading sessions, including misses. Past sessions can be looked at, but no historical equity curves and no "if you had taken every signal" math.
- 04
You want full automation.
When the bot's live feed lands (rolling out over the next 1–3 months), it will publish real entries and exits the moment they fill — strike, stop, target — for you to mirror in your own IBKR account or anywhere else. We never push trades into your account. Your finger. Your trigger.
- 05
You can't stomach a wrong day.
Some sessions the levels miss. Dealer flow re-positions, the bot fires a stop, the day ends red. If one bad week ends your subscription, we both lose time.